
0
Answered
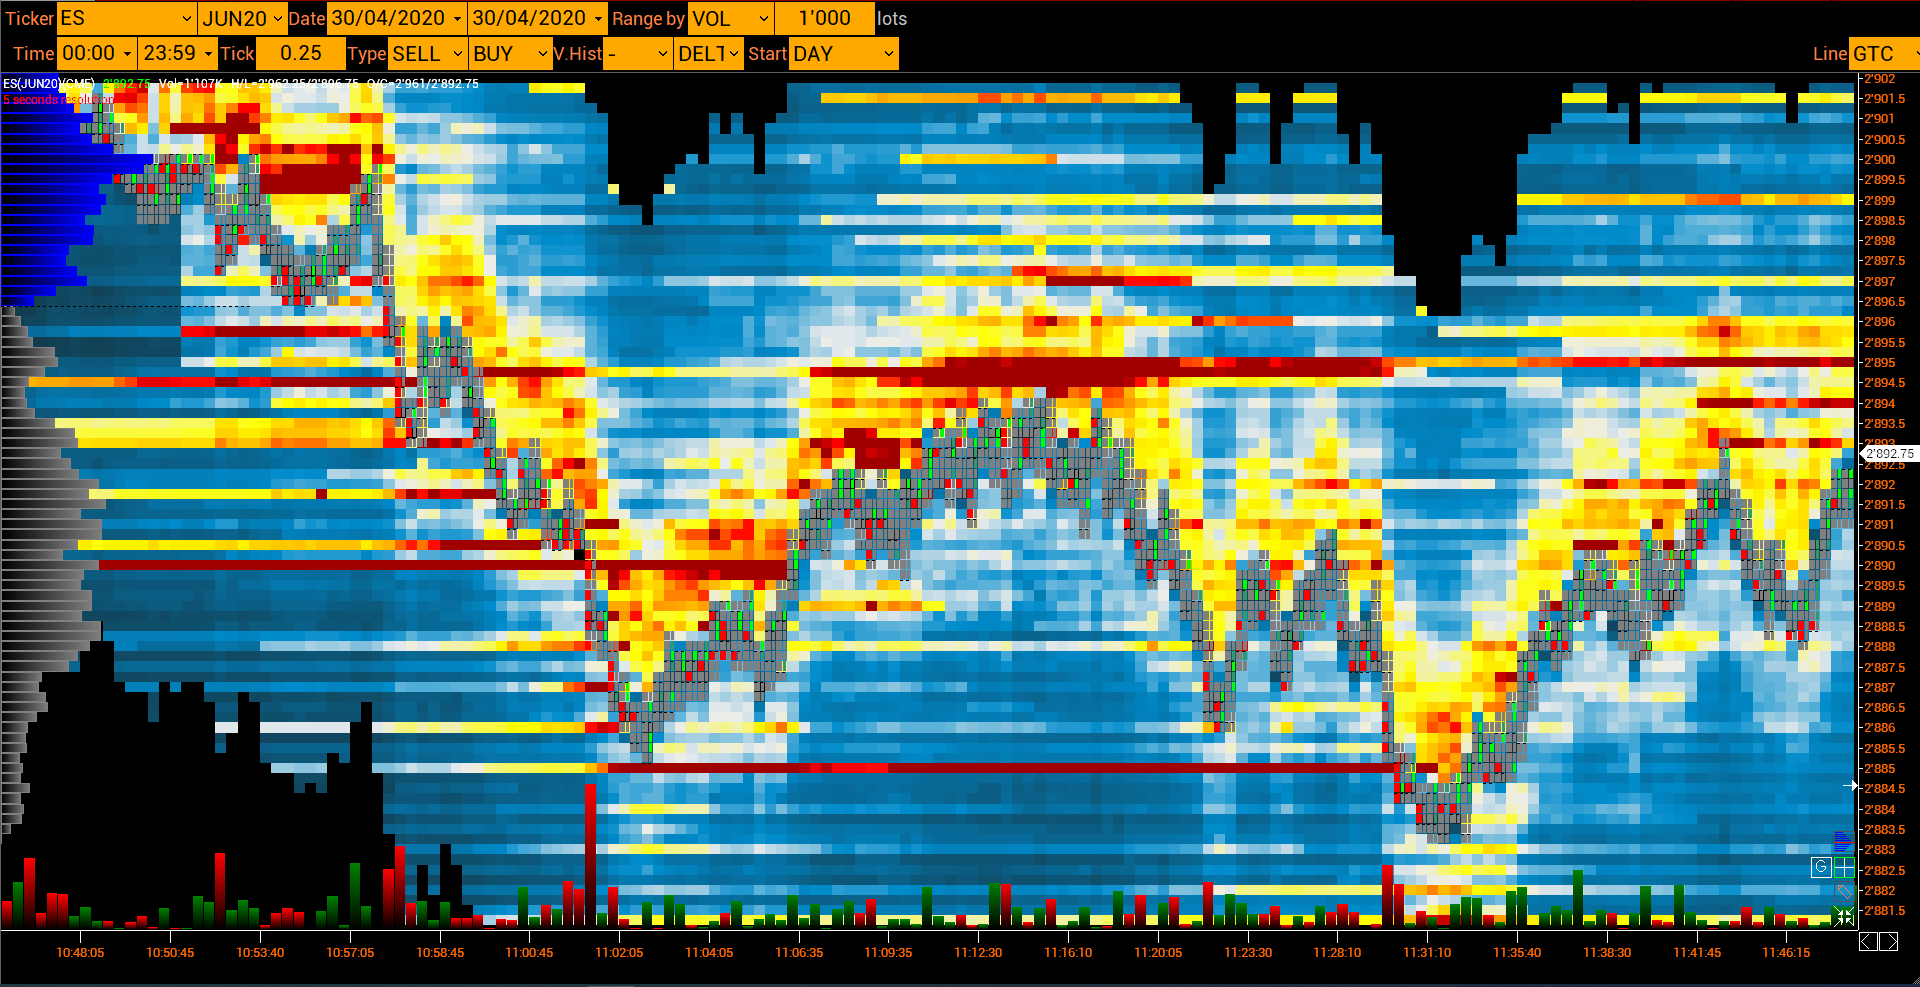
heatmap
raccomandare di considerare questa funzione utile e dare maggiore risalto a ciò in modo che possiamo anche motivare possibili sviluppi futuri grazie
Ringrazio gli sviluppatori volfix per l'eccellente lavoro svolto e il risultato ottenuto, e sono sicuro che in futuro otterremmo anche un prodotto migliore con informazioni più chiaramente visibili sul grafico della mappa di calore
Customer support service by UserEcho
How does it help you?
on you look at any chart you see only the orders executed only if you also look at the heatmap you can also see the passive liquidity that is all the sell limit and buy limit orders also not executed and you can see based on the movement of the price where there was more offer than liquidated and where this has resisted
I tried to use heatmap yesterday and face the following problem:
When the price enters the zone of passive liquidity - it is difficult to understand whether the rebound will be carried out in the opposite direction. It is especially difficult to understand if the price has remained in the zone of passive liquidity for a long time.
liquidity attracts the price and can reject the price what it does and where the movement goes it can also be combined with other volumetric indicators of course if everything were possible to see it on a page it would be better. e.g. order frequency, delta, buy line and sell line etc. etc.
And also passive liquidity zones are deceiving)) when the price drops to low, they like to substitute orders from above, making it clear that the price will go lower - which is a hoax. So with the heatmap, not everything is perfect as we would like.
You can look at volume - but not during periods of volatility.
The frequency of ticks often portends the interest of a market maker, but the limit needs to be set more.
it is difficult to operate with a delta since a large market order can fundamentally change the situation, which was in the consolidation.
It is too difficult and often unsuccessful to estimate the probability using many parameters.
my idea, and not only mine but of many other traders, and which can be much more useful than looking at a normal order flow can be a limit because I can't see the shift of the passive liquidity sell limti and buy limit, the use of this indication is never taken for granted but a careful observation of the instrument follows, certainly you are right that they can confuse like so many other indications but at least I see what with anything other than a heat map I cannot see, then of course perhaps there are no indications additional on this paitta but giaq so it can be very useful hello sorry if I replied late