Welcome to the support center of VolFix

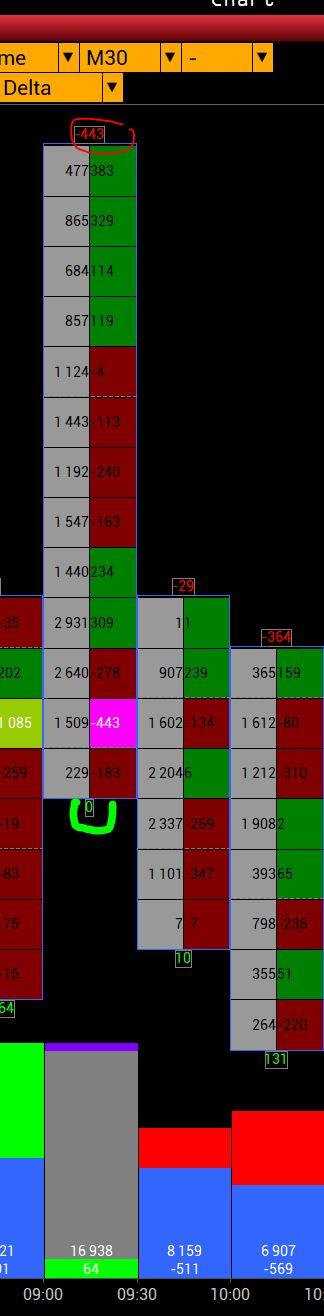
 Calculation Maxdelta Minidelta
Graph eurusd future - 5 feb 25- 9h00
Hello,
Could you please explain the calculation of Maxdelta and Minidelta. Thank you
Pending Limit Orders
Hello , 6 Fev 25
We miss the pending limit orders, a big plus for the VOLFIX platform. Thank you for your reply.

Cluster imbalance
Bonjour,
Est-il possible de configurer les imbalances sur le footprint pour afficher uniquement les imbalances quand il y en a plusieurs qui se suivent ? J'aimerais afficher les imbalances en couleurs uniquement si il y en a 3 ou 4 qui se suivent.
Merci
Hi,
Is it possible to configure the imbalances on the footprint to display only the imbalances when there are several that follow each other? I would like to display the imbalances in color only if there are 3 or 4 that follow each other.
Thank you

 All open DOM centering hotkey
Добрый день! Очень не хватает горячей клавиши центровки всех открытых стаканов. Нужно для отслеживания смежных инструментов - NQ ES YM RTY. Было бы удобно это делать клавишей Tab (одной). Спасибо
Good day! I really miss a hot key for centering all open DOM. It is needed to track adjacent instruments - NQ ES YM RTY. It would be convenient to do this with the Tab key (one). Thank you
Add-on CVD
Hello, Jan 28, 2025
Add-on CVD
Should confirm Max Delta and Min Delta:
1-Profile -->Vertical histogram : off/on
2-Histogram type --> Cum Delta
3-Choice representation
a: line
b: vertical column (sticks)
Easier reading. Thanks
 RTH CL start period in Volfix
Здравствуйте. При переключении графика CL в режим RTH сессия начинается в 8:30. Если я не ошибаюсь, сессия Crude Oil на NYMEX начинается с 8:00. Спасибо.
Hello. When switching the CL chart to RTH mode, the session starts at 8:30. If I am not mistaken, the Crude Oil session on NYMEX starts at 8:00. Thank you.
VWAS indicator
Hello, (January 9, 2025).
1- VWAS indicator, --->add this general indicator. Seems interesting.
2- Profile P , --> add vwas, to test with vwap, calculation of differences., vertical histogram or other representation.....
Thanks.
dom central
Ребята, было бы очень полезно отображать центральную линию при центровке стакана. И если бы можно было центровать все окна DOM одной hot key - было бы вообще здорово
Cluster classic
Hello
Cluster classic m30 euro us dollar future
6E --1 day
setup --studies--horizontal histogram--on volume today
Point of control day value 1
6E--2 days
setup idem
Point of control day value 2 different from value 1
-----------------------
6E --1 day
setup --studies--vert histogram
on volume
on delta
No results; no histogram
6E--2 days
setup same
Display histogram volume / delta
--------------------
Please check, not sure about my analysis ...
Best regards.
Customer support service by UserEcho