
Your comments
ci saranno novità per volfix nella nuova versione alpha e grazie
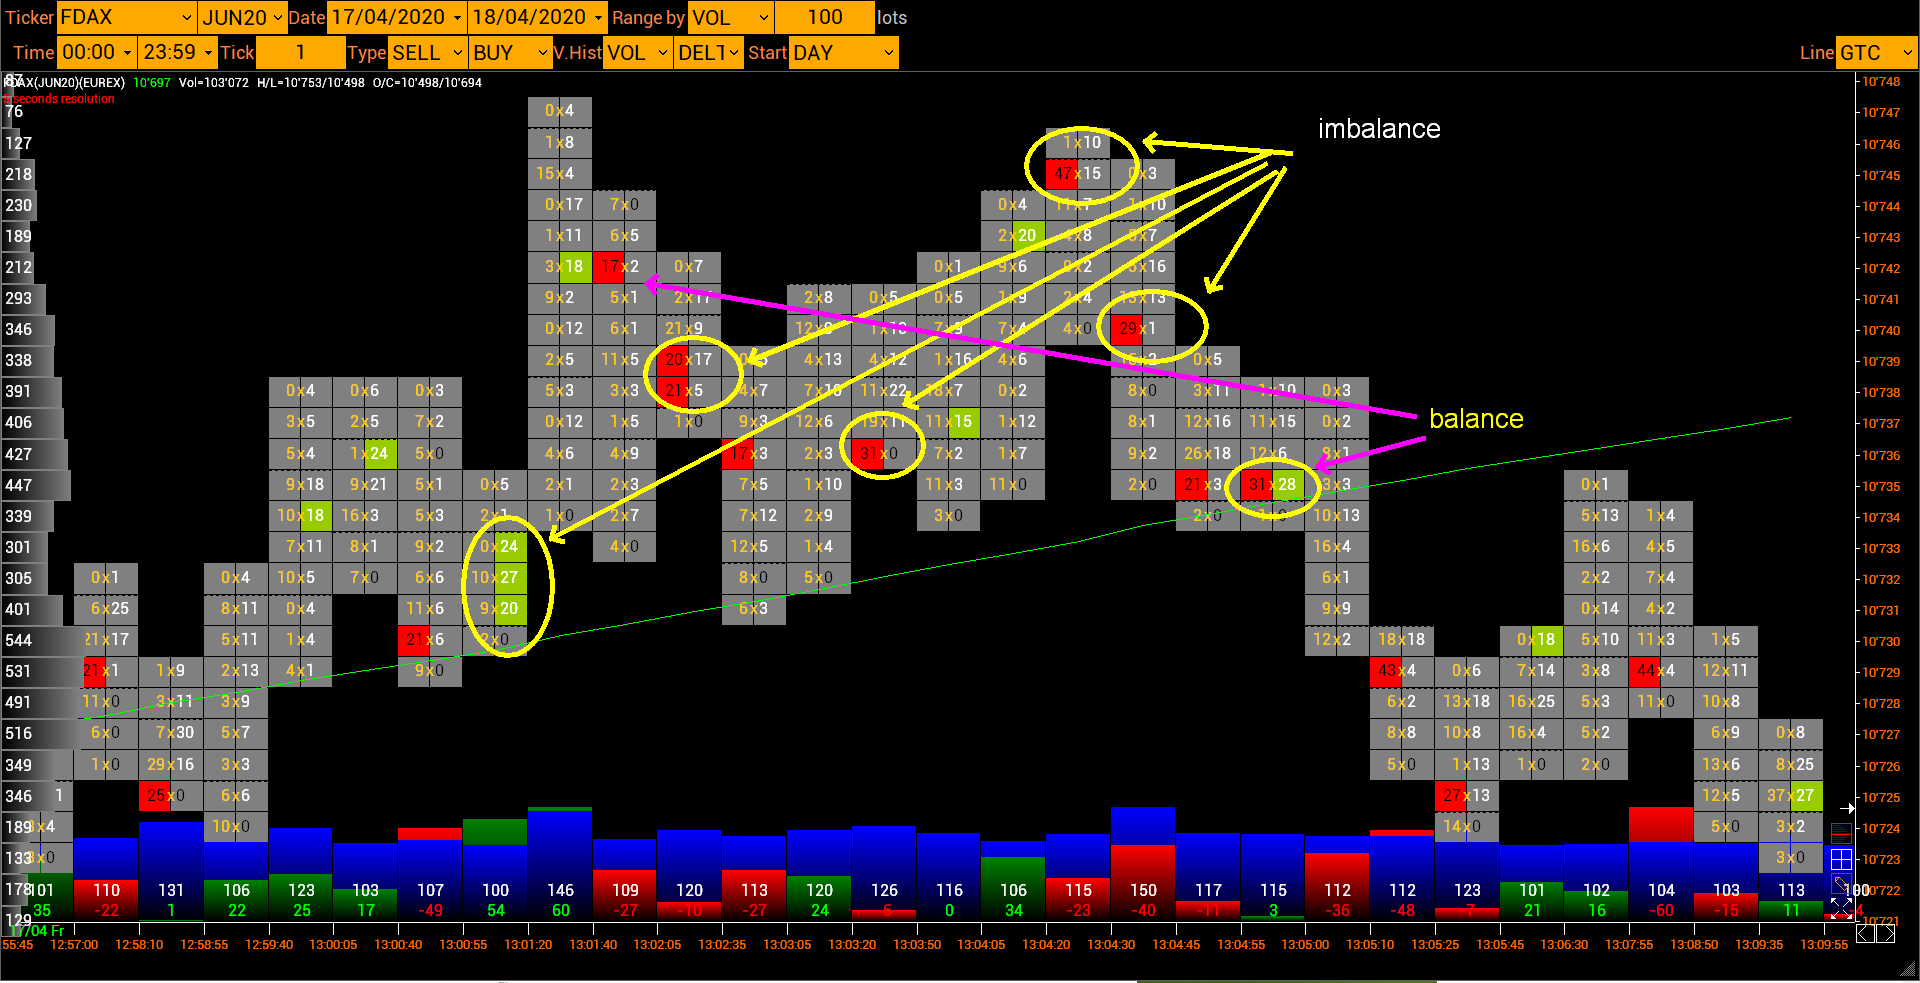
my idea, and not only mine but of many other traders, and which can be much more useful than looking at a normal order flow can be a limit because I can't see the shift of the passive liquidity sell limti and buy limit, the use of this indication is never taken for granted but a careful observation of the instrument follows, certainly you are right that they can confuse like so many other indications but at least I see what with anything other than a heat map I cannot see, then of course perhaps there are no indications additional on this paitta but giaq so it can be very useful hello sorry if I replied late
liquidity attracts the price and can reject the price what it does and where the movement goes it can also be combined with other volumetric indicators of course if everything were possible to see it on a page it would be better. e.g. order frequency, delta, buy line and sell line etc. etc.
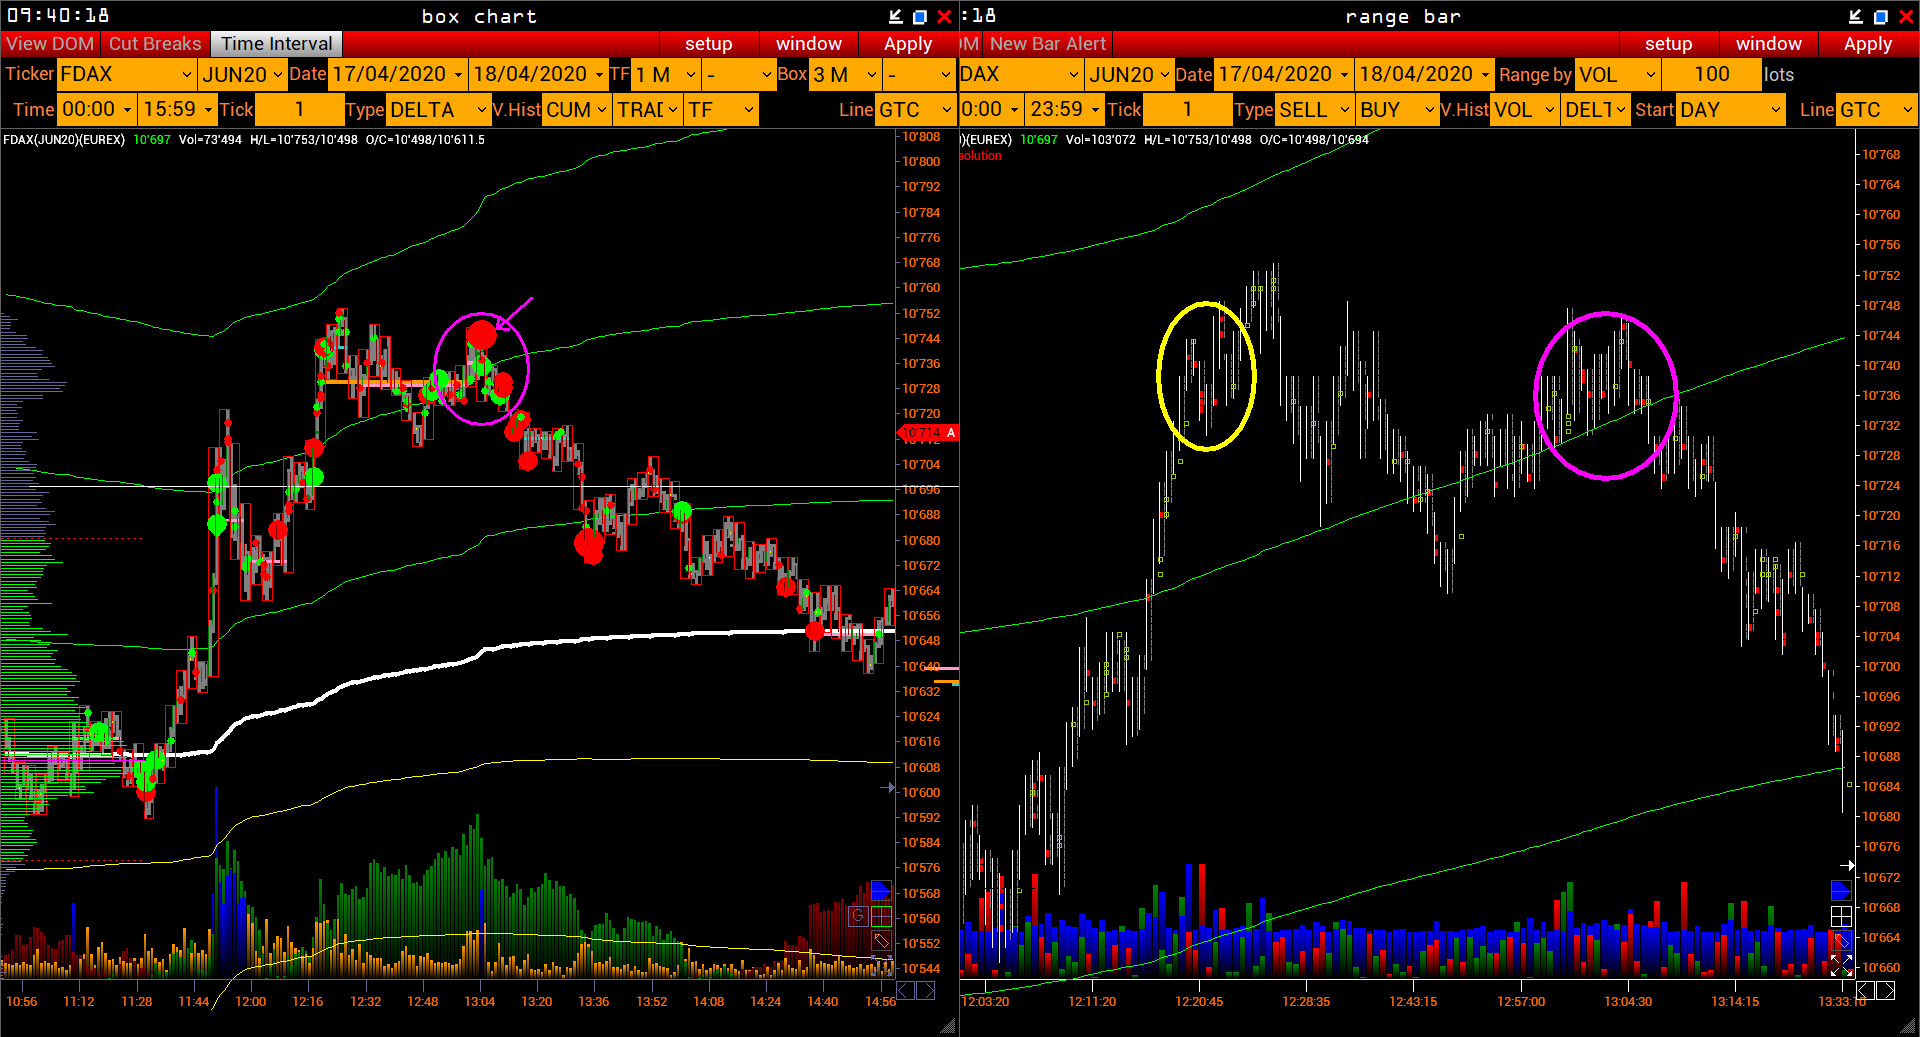
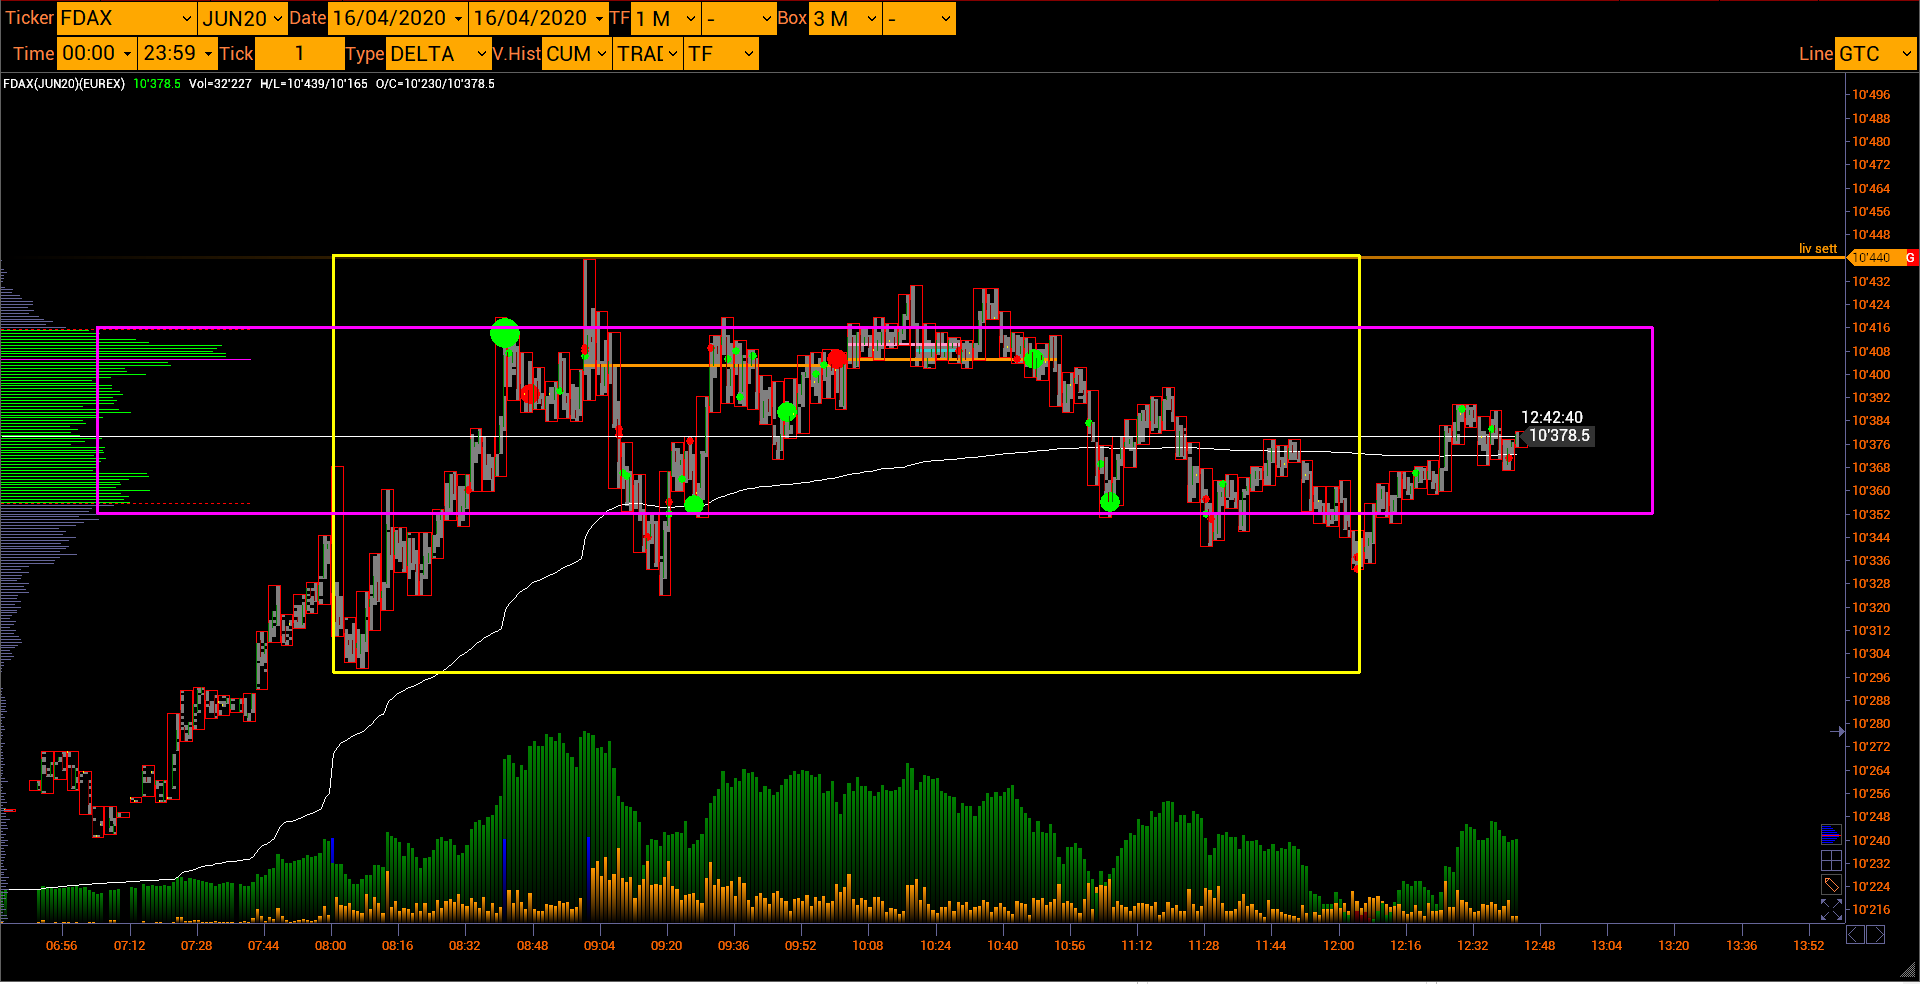
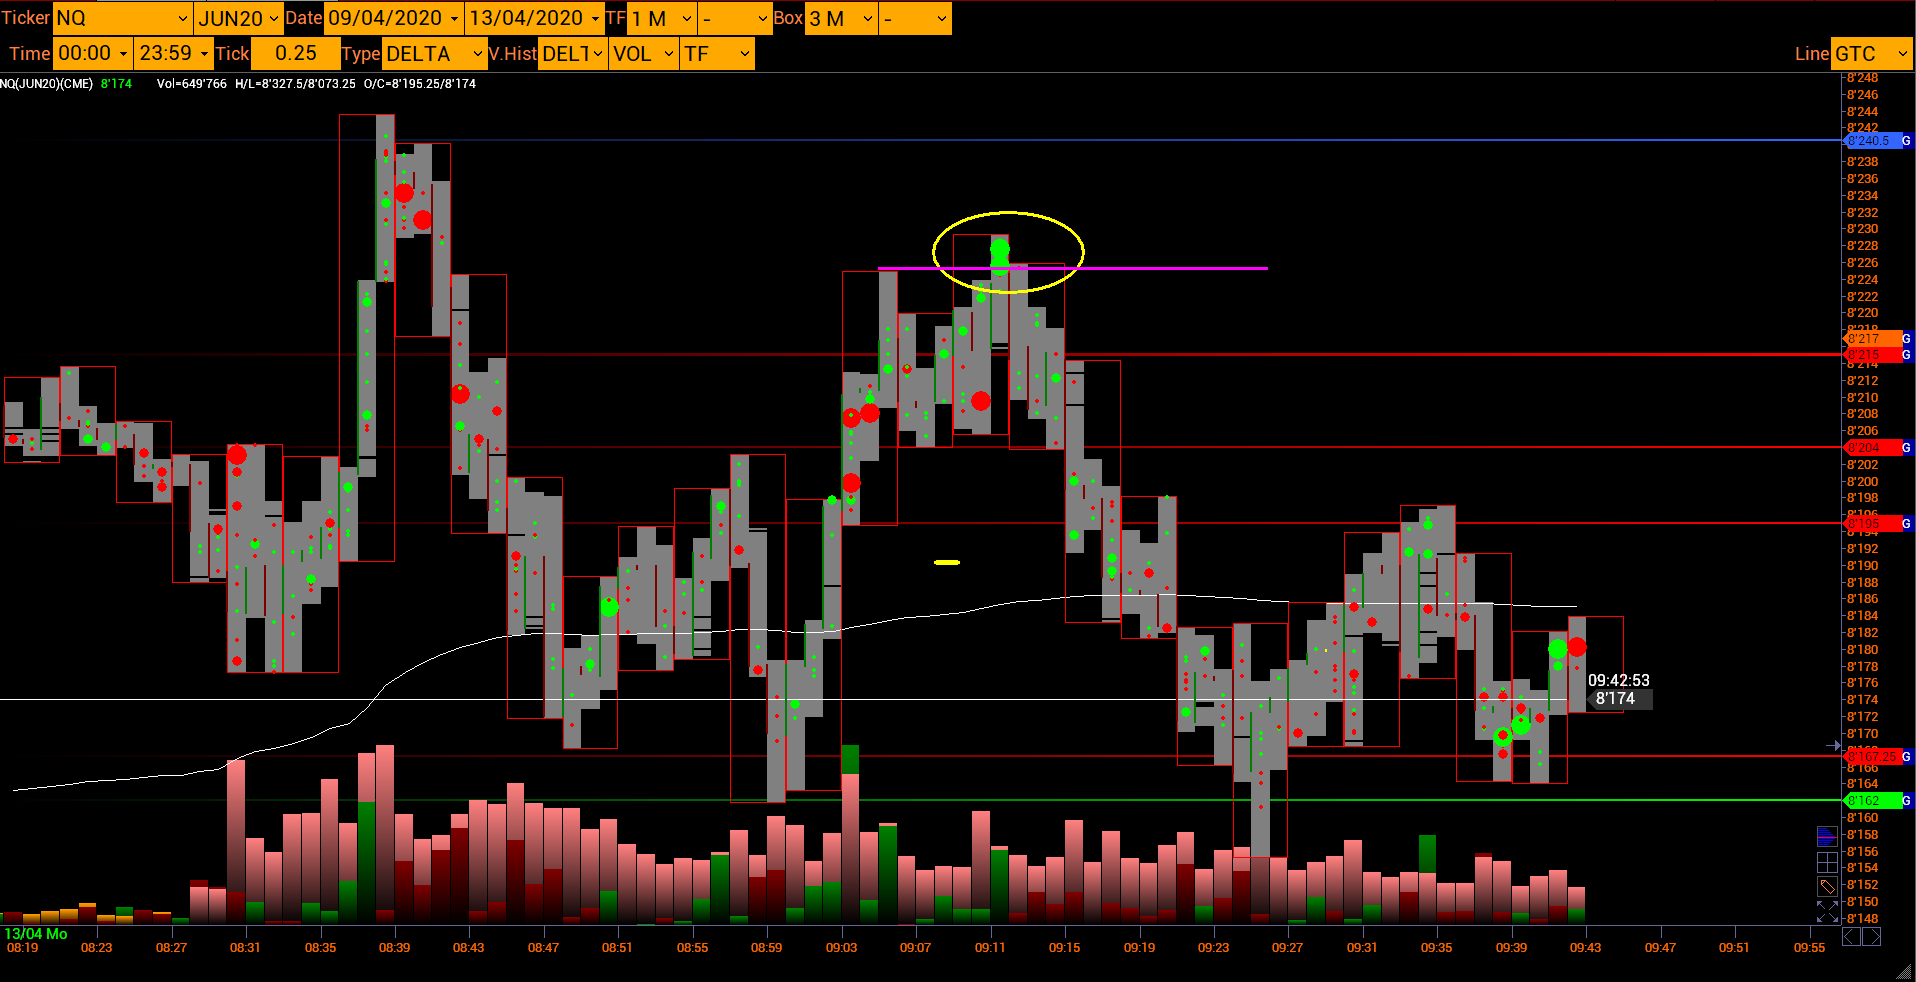
on you look at any chart you see only the orders executed only if you also look at the heatmap you can also see the passive liquidity that is all the sell limit and buy limit orders also not executed and you can see based on the movement of the price where there was more offer than liquidated and where this has resisted
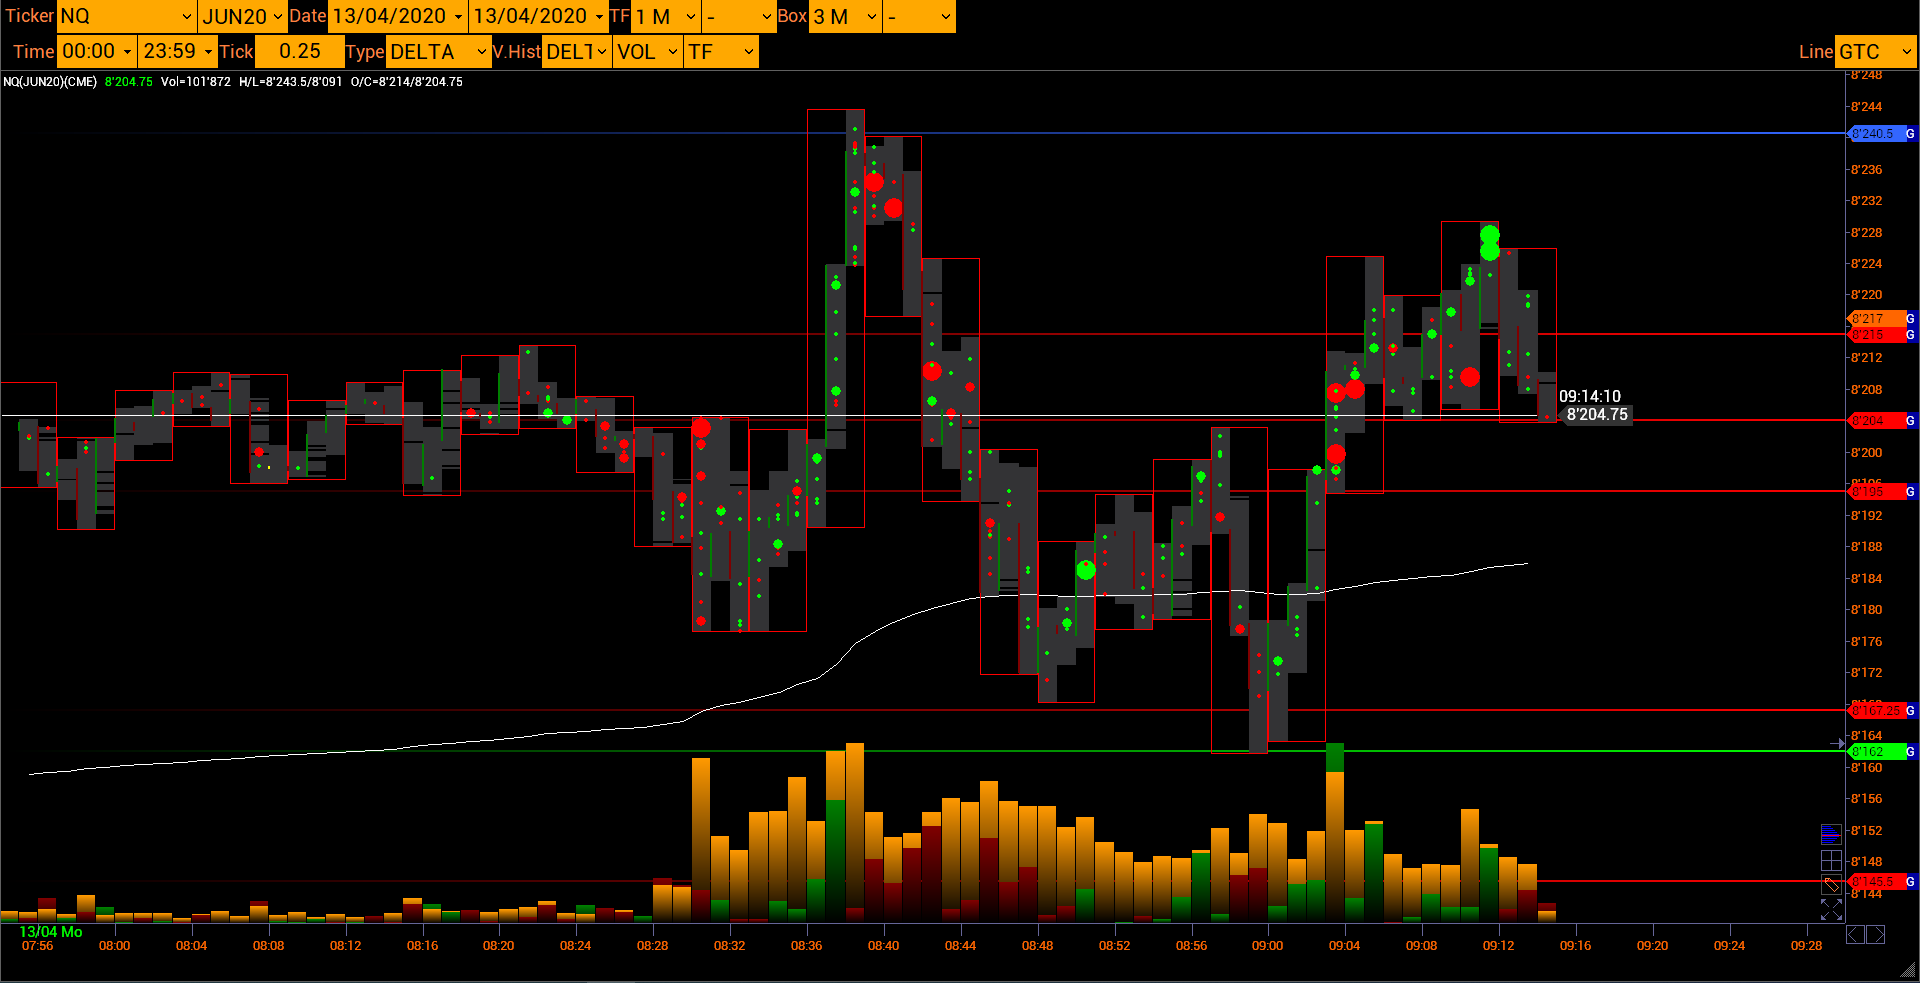
you can use it in many ways the important and know the index and know which are the important volumes that create direction, under just an example of how and when I use it
and then use it with another good big trade tool
function increasingly useful

You can activate it on a graph and on the same graph deactivate to not see cewerchi anymore but the solid helps a lot the immediate mink my opinion
scusa se mi sono intromesso nella discussione
excellent volfix function allows you to see areas of possible absorption and exhaustion advice to everyone to try
this function
volfix support the best one hour and solved the problem congratulations
Customer support service by UserEcho
sorry but if I take a day of work and it gives me a positive and engaging p & l result as it may be possible not to do an equity day of the closed operations in the day that bring a positive or negative p & l, I can do this by taking the closed operations in the day with execel I can create an equity line because on folfix it is not possible to do it? if I then looking at the oeprazioni of the day I have a positive or negative p & l? if I calculate the p & l and surely a summation then why is it not possible to have an equity line ???
I ask only one simple thing, in the bear of the day or the eprido chosen by me how my operations went as below number of operations and p & L